Figure 2.
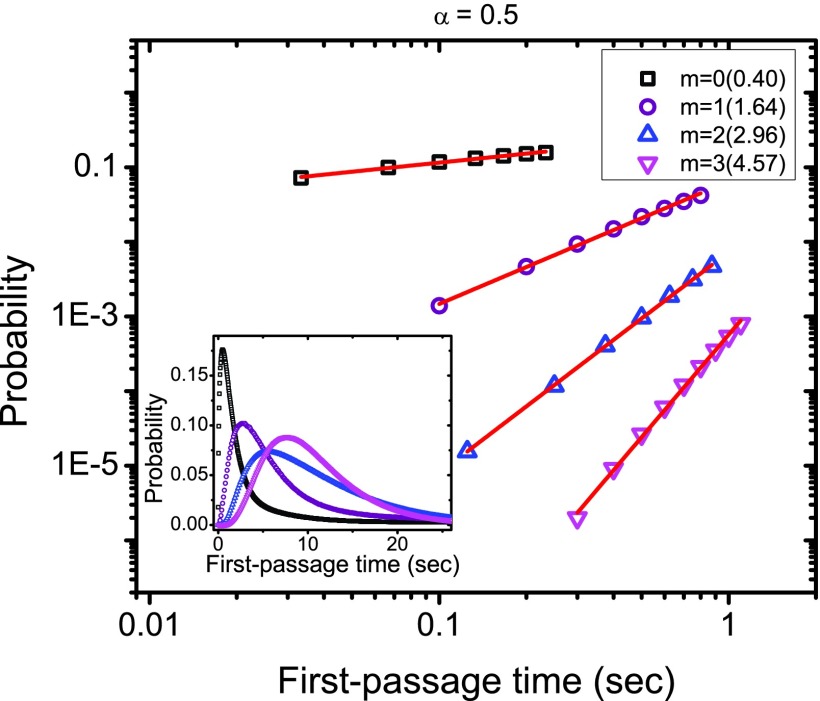
First-passage time probability densities for the network shown in Fig. 1 with the parameter α = 0.5. The initial state i is the red vertex i and the final states are green vertexes labeled from j0 to j3 as given in Fig. 1. The main figure shows the probability densities at early times and the inset gives the probability densities over all times. The data from computer simulations are presented by different symbols for various final states. The solid lines correspond to the linear fits of the simulation results. The number m of intermediate states for the shortest path between the initial and final states and the slope for each curve are also indicated.

