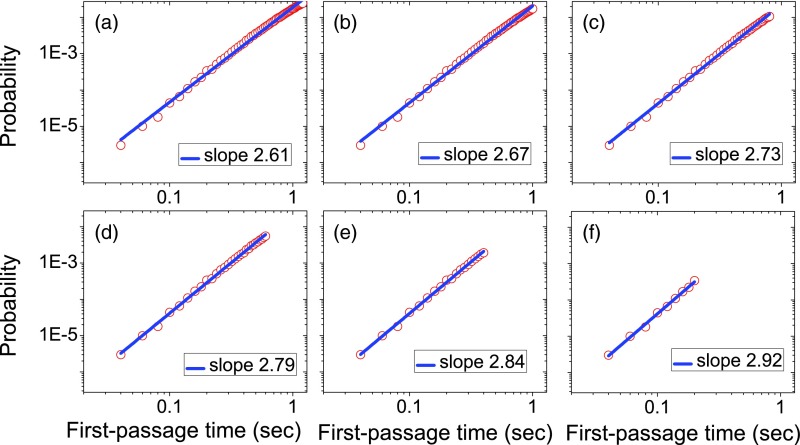
Figure 5.
First-passage time probability densities for the network shown in Fig. 1 with the initial state i, the final state j1, and the parameter α = 1 at early times. The data from computer simulations are presented by red open circles. The blue solid lines correspond to linear fittings of the simulation results. We considered different time ranges for linear fittings of the probability densities. The simulation data shown are same in all figures but the time range used for the linear fitting is reduced from (a) to (f), and the value of the slope from each fitting is also indicated.

