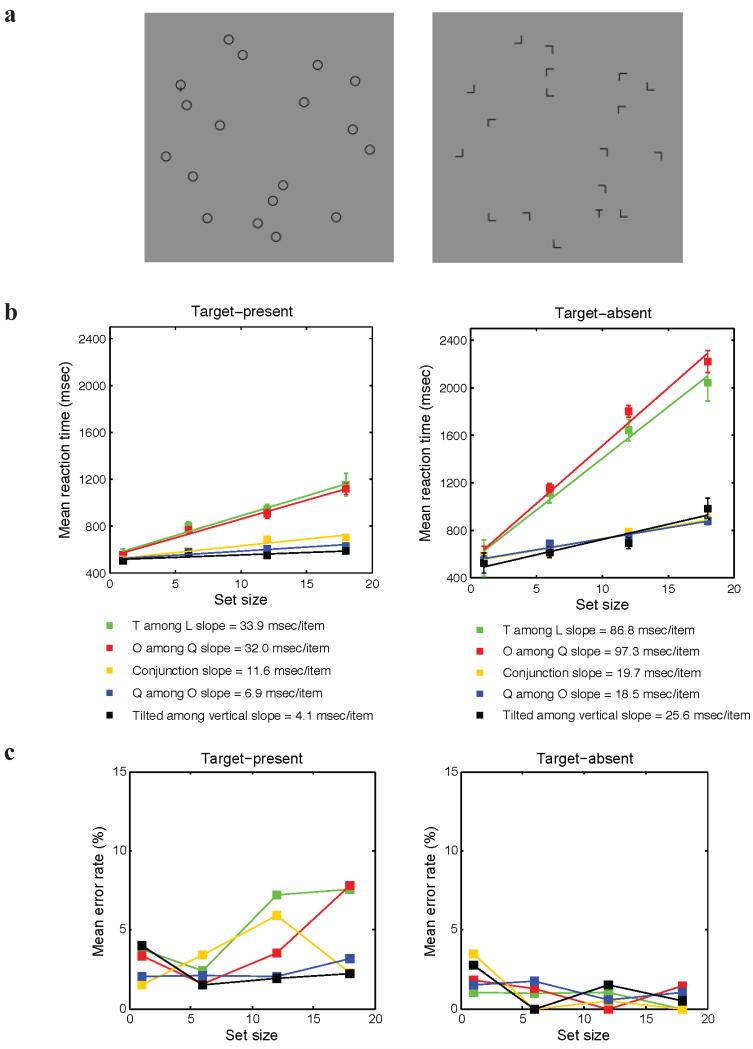
Figure 3.
We replicated 5 classic search experiments. (a) Example stimuli for Q among O (left) and T among L (right) search, set size = 18. (b) Mean reaction times (RTs) for correct trials, averaged across subjects. Error bars show standard errors. The legend gives the slopes of the RT vs. set size functions. (c) Error rates on target-present and target-absent trials, for each combination of set size and search condition.

