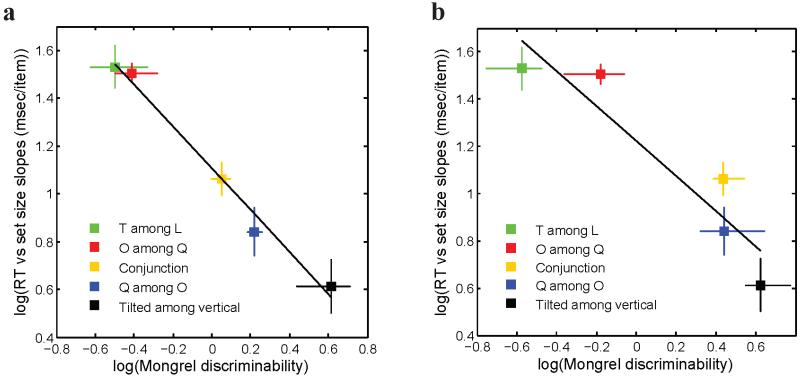
Figure 5.
Testing whether peripheral representation of patches by summary statistics predicts visual search performance. The y-axis shows search performance for correct target-present trials, as measured by log10(search efficiency), i.e. the mean number of milliseconds (msec) of search time divided by the number of display items. The x-axis shows log10(d’), the discriminability of the mongrels corresponding to target+distractor and distractor-only patches. Clearly there is a strong relationship between visual search difficulty and the mongrel discriminability, in agreement with our predictions. (y-axis error bars = standard error of the mean; x-axis error bars = 95% confidence intervals for log10(d’).). (a) Experiment 1. Adapted from Rosenholtz et al (2012). (b) Experiment 2.

