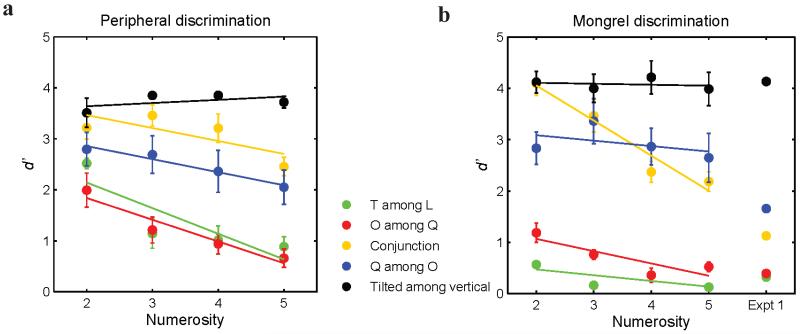
Figure 9.
(a) Peripheral d’, plotted vs. patch numerosity, for each of the five conditions. (b) Mongrel d’, plotted vs. patch numerosity, for each of the five conditions. Solid lines present linear fit to each condition’s d’. The rightmost markers show mongrel d’ obtained in Experiment 1. Error bars are within-subject standard errors of mean d’.

