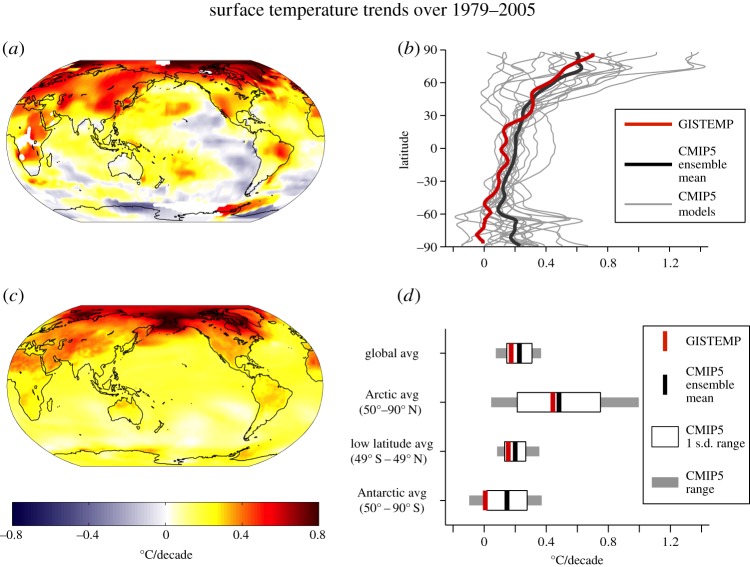
Figure 1.
Surface temperature trends over 1979–2005 from (a) the GISS Surface Temperature Analysis (GISTEMP) [1], (c) an ensemble of CMIP5 models. (b) Zonal-mean surface temperature trend from GISTEMP (red line), CMIP5 ensemble mean (black line), individual CMIP5 models (grey lines). (d) Surface temperature trends averaged over latitude bands (global, Arctic, low-to-mid latitudes and Antarctic), for GISTEMP (red line) and CMIP5 ensemble mean (black line); the white boxes show the CMIP5 ensemble ±1 s.d. range, and the grey boxes show the full CMIP5 ensemble range. All trends are expressed in °C/decade.

