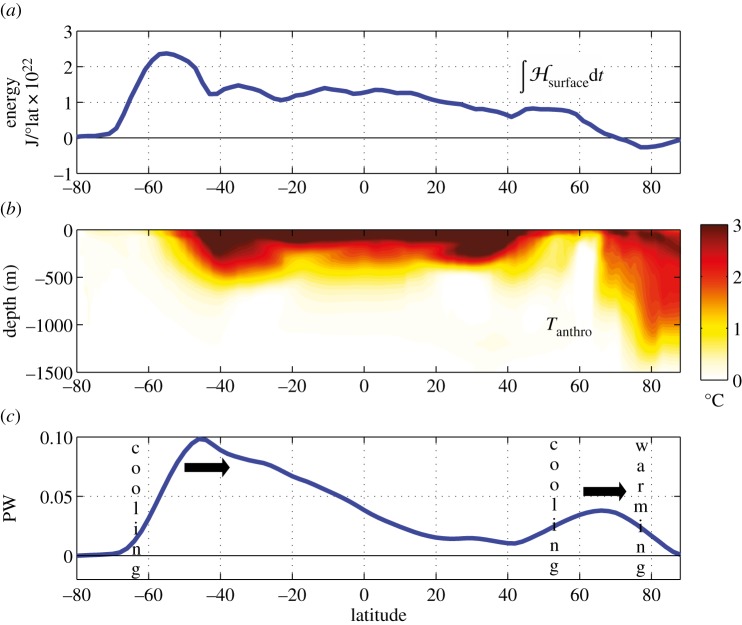
Figure 4.
(a) Surface energy accumulation integrated over 100 years in J/°lat ×1022. (b) Meridional section of zonal-average Tanthro after 100 years from the ocean-only configuration of MITgcm whose SSTanthro is shown in figure 2b. (c) Anomaly in meridional ocean heat transport (in PW) after 100 years relative to a control integration. Latitudinal bands of implied ocean warming and cooling are marked.

