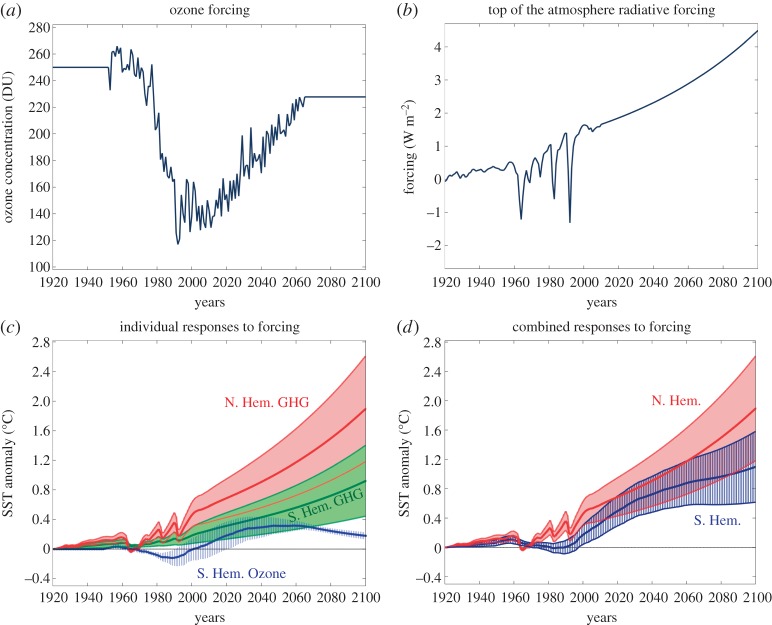
Figure 7.
(a) Observed ozone concentration (in DU) over the Antarctic and projections into the future assuming that the ozone hole heals at the present observed rate (courtesy of WACCM and Diane Ivy, MIT). (b) Historical net TOA radiative forcing (in W m−2; dominated by GHGs) from Hansen et al. [60] and projections into the future assuming that the forcing increases smoothly to 4.5 W m−2 from 2010 to 2100, consistent with a standard RCP4.5 scenario. (c) Individual convolutions of the GHG and the ozone-hole forcing plotted on the top, with the respective GHG and ozone-hole CRFs plotted in figure 3, yielding estimates and projections of SST anomalies north of 50° N (Arctic: red due to GHGs) and between 50° S and 70° S (Antarctic: green due to GHGs and blue due to ozone-hole forcing). (d) Combined SST responses to GHG and ozone forcing north of 50° N (Arctic: red) and 50° S and 70° S (Antarctic: blue, sum of green and blue in (c).).

