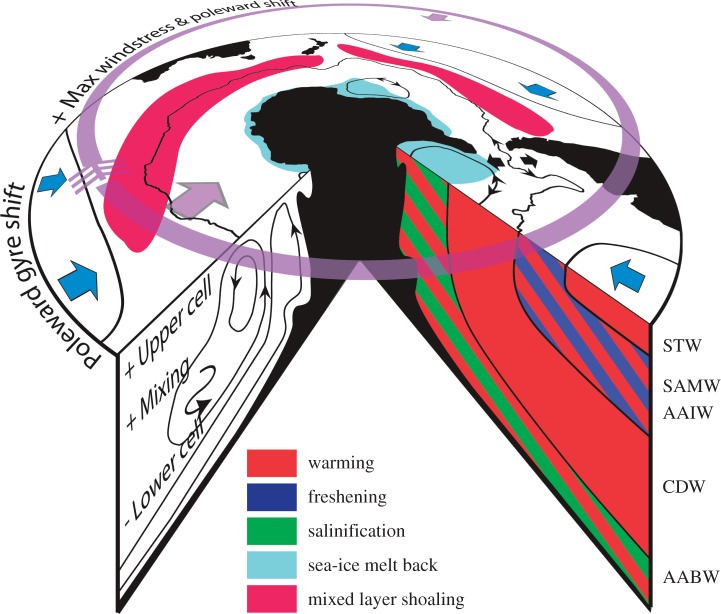
Figure 6.
Schematic showing the impact of climate forcing in CMIP5 models in the Southern Ocean by the end of the twenty-first century. See text for more details. Arrows in both directions for the ACC and subpolar gyres indicate significant changes in transport of both signs within the model ensemble.

