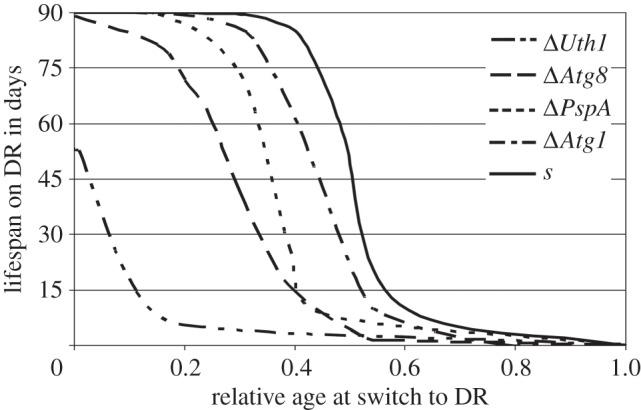
Figure 6.

Fitted curves of the DR response at relative ages at onset of DR (PASM with 0.02% w/v glucose) for the autophagy-deficient mutants (ΔPaUth1, ΔPaAtg8, ΔPaPspA andΔPaAtg1), and the wild-type parental strain s (in order of appearance from left to right; growth experiments were stopped after 90 days, p-values fitted curves of less than 0.001). Refer to the electronic supplementary material, figure S1 for the individual replicate data points.
