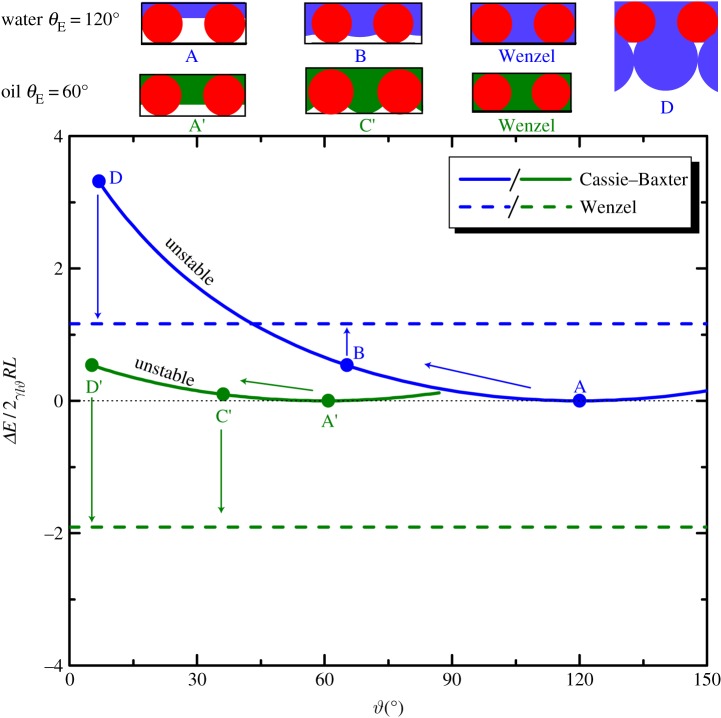
Figure 5.
Plot of the total surface energy of the composite solid/liquid system against the angular position ϑ of the interface on a one-dimensional array of parallel cylinders of diameter 2R, half-spacing D with a dimensionless geometric spacing D* = (R + D)/R = 1.5. The solid curves indicate the energies of the composite interface corresponding to the Cassie–Baxter non-wetting state, and the dashed line indicates the surface energy of the fully wetted Wenzel state. The blue and green curves are evaluated for water (θE = 120°) and a typical oil (θE = 60°) respectively. A schematic of the liquid meniscus corresponding to the initial state A, depinning transition state B, sagging transition state C and the Wenzel state are shown above the plots. State D is associated with the coalescence transition proposed by Bormashenko, when a rigid, underlying substrate below the feather is absent, as shown in the sketch. (Online version in colour.)

