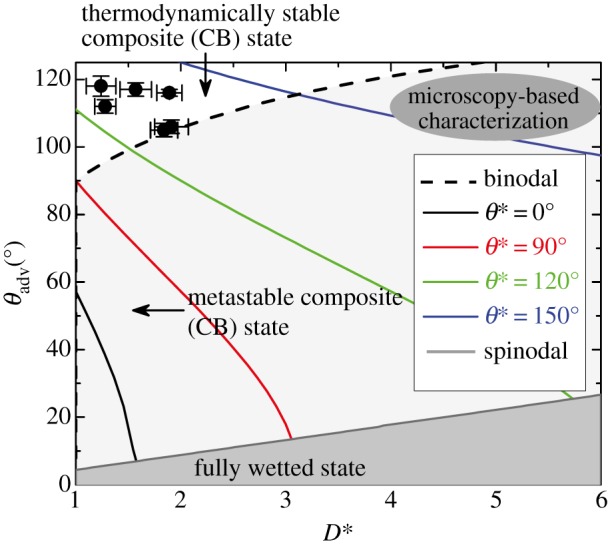
Figure 6.

A phase diagram of surface wettability is plotted with measured advancing contact angles (θadv) for water on the ordinate and a best-fit value of the effective spacing ratio (D*) on the abscissa. Isocontours of constant apparent contact angle (evaluated using equation (3.1)) are shown by solid coloured lines. The dashed line corresponds to the binodal line (equation (3.4)) separating the thermodynamically stable Cassie–Baxter (CB) states and the metastable CB states (light grey). The measured water contact angle data for the six bird species under consideration all lie above the binodal where the composite interface is the equilibrium state. The metastable region of the chart below the binodal (light grey) is obtained by equating the Laplace pressure of a water drop with radius equal to its capillary length, to the Pb calculated from equation (SI-8) with R = 5 µm. The solid grey line indicates the spinodal. In the region below the spinodal, the CB state is unstable and will undergo a spontaneous transition to the fully wetted Wenzel state. (Online version in colour.)
