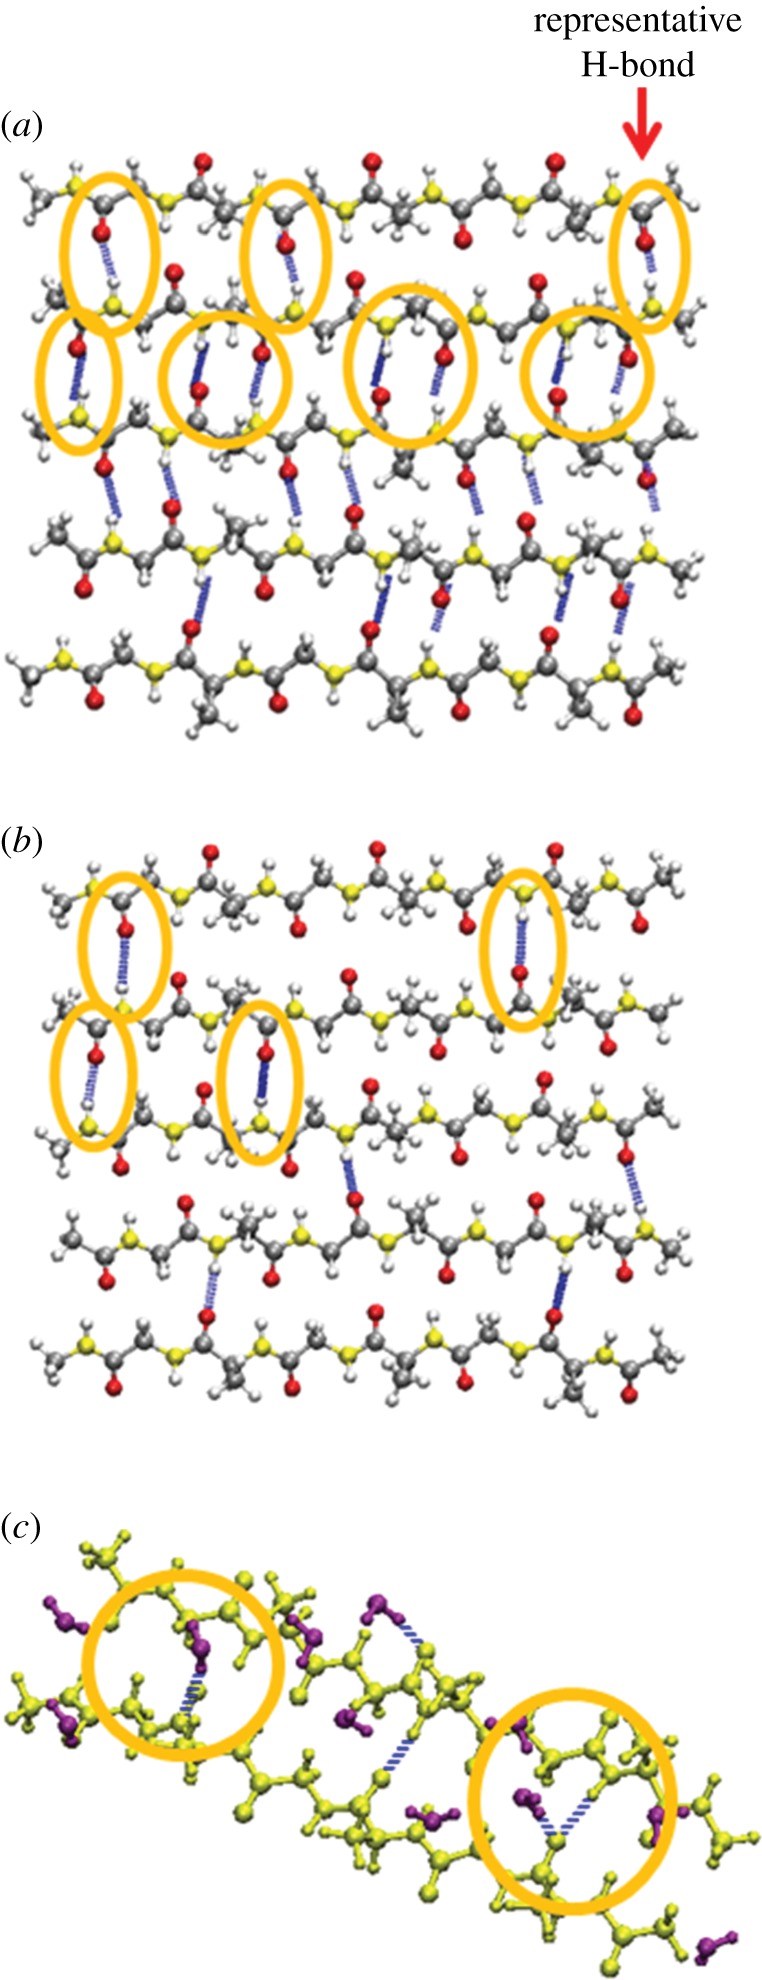
Figure 3.

Hydrogen bond analysis on the representative β-sheet crystallite structures at equilibrium. (a) Snapshot of the β-sheet chains on the SL in vacuum. (b) Snapshot of the β-sheet chains on the SL in water. Hydrogen bonds are illustrated in blue and those located among the top three chains are highlighted. (c) Snapshot of two representative β-chains on the SL interacting with water molecules. β-chains are displayed in yellow, and water molecules are displayed in purple.
