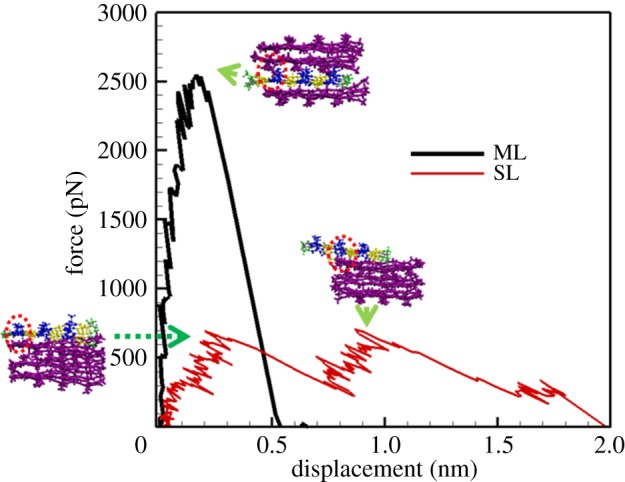
Figure 6.

Force–displacement curves for pulling out the ML and the SL, respectively. Snapshots of the crystallite unit corresponding to the rupture force at peaks are also provided. Residues of the peptides in the targeted layer are displayed in blue and yellow, while the rest are displayed in purple.
