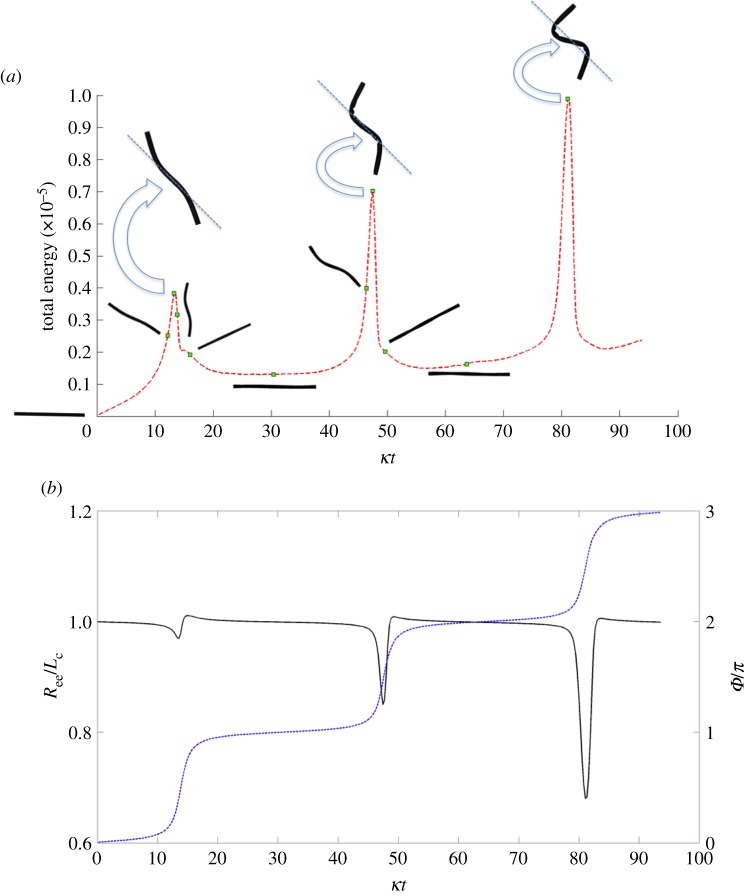
Figure 9.
(a) Evolution of the total elastic energy of the surface-spring fibre as it rotates in shear. The square dots represent the total energy associated with the shapes of the fibre at the different times shown in figure 8. (b) Evolution of ratio of end-to-end distance Ree to equilibrium length Lc (solid line) and orientational angle of the surface-spring fibre's orbit (dashed line) shown in figure 8. (Online version in colour.)

