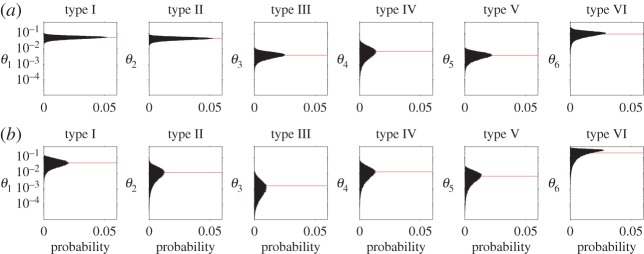
Figure 3.

Results of experiment 1, in the form of posterior distributions on concept difficulty from participants' responses in (a) the optimized game and (b) the random game; red lines indicate the mean of each distribution. Each panel shows the distribution over the inferred difficulty of a concept with the given structure (types I–VI), as reflected by its prior probability in the Bayesian model. Concepts with higher prior probability are easier to learn. Note the logarithmic scale on the prior probability of each θi.
