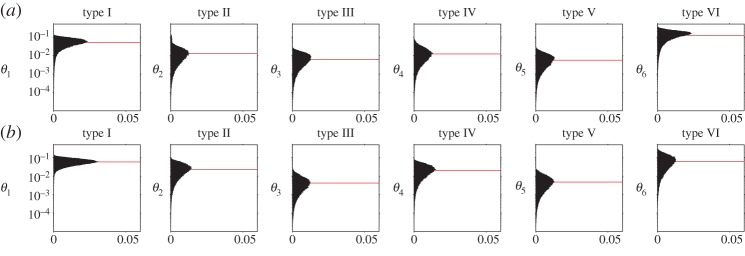
Figure 7.

Results of analysing data from experiment 1 using POMDPs, in the form of posterior distributions on concept difficulty from participants' responses in (a) the optimized game and (b) the random game; red lines indicate the mean of each distribution. Each panel shows the distribution over the inferred difficulty of a concept with the given structure (types I–VI). Note the logarithmic scale on the prior probability of each θi.
