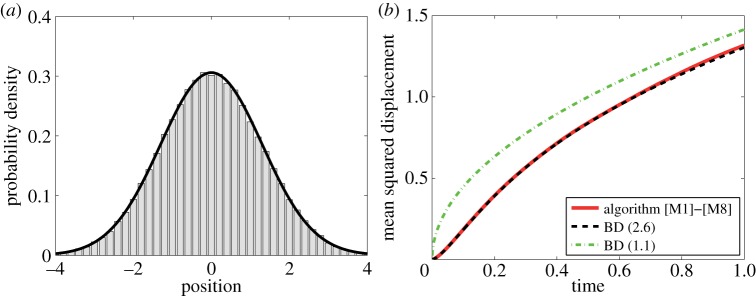
Figure 3.

(a) Probability distribution of the heavy particle at time t=1 computed by the multi-scale algorithm [M1]–[M8] (grey histogram) is compared with the distribution (4.9) given by the BD model (2.6) (black solid line). (b) The time evolution of the mean squared displacement computed by 105 realizations of the algorithm [M1]–[M8] (solid line) is compared with equation (2.13) (dashed line) and (dot-dashed line). We use μ=103, γ=10, D=1, Δt=10−7, L=10, R=1, X(0)=0 and V (0)=0. (Online version in colour.)
