
Figure 2.
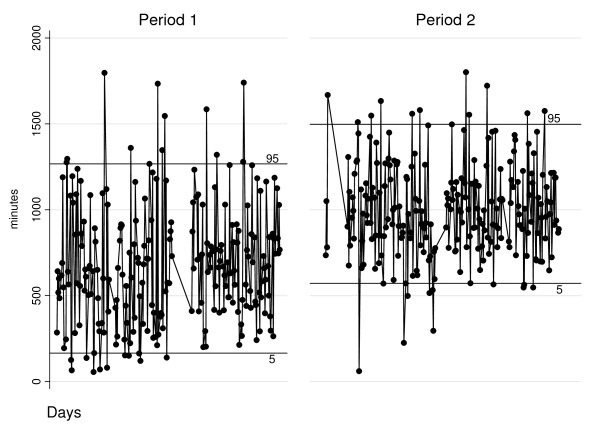
Daily non-elective case time (day shifts, weekdays), two-way graph. Each circle corresponds to one day shift; the lines indicate the 5th and 95th percentiles; the areas without observations represent low-activity periods, such as Public Holidays and vacations.