Figure 3.

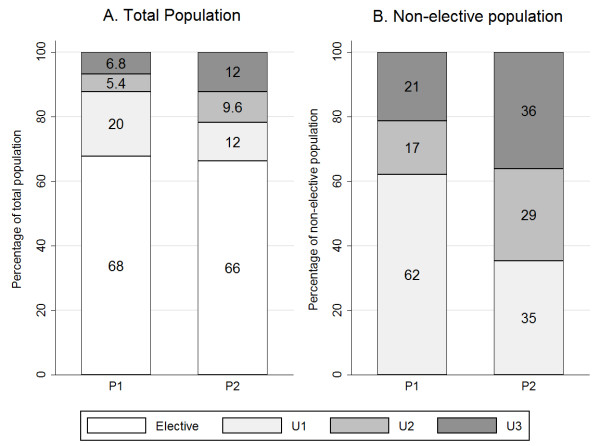
Percentage distribution of patient categories by population. A: Elective, U1, U2 and U3 percentages of total population. B: U1, U2 and U3 percentages of the non-elective population.

Percentage distribution of patient categories by population. A: Elective, U1, U2 and U3 percentages of total population. B: U1, U2 and U3 percentages of the non-elective population.