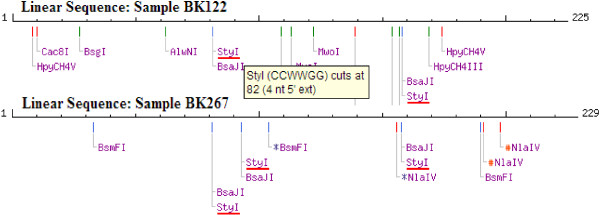
Figure 4.

in silico StyI restriction map for the DARC gene promoter fragment sequence. This shows sites for StyI restriction (red horizontal bars) in two of the subjects assessed – one Duffy positive (BK122) with 2 StyI restriction sites and the other Duffy negative (BK267) with 3 StyI restriction sites.
