Figure 10.

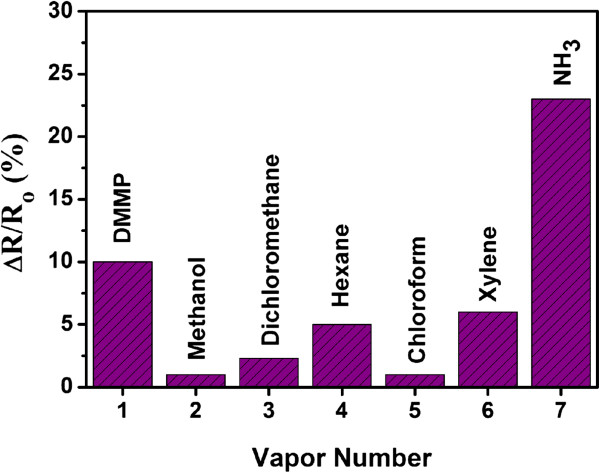
Selectivity plot of the assembled Py-rGO sensing device. Selectivity plot of the assembled Py-rGO sensing device exposed to 100 ppm NH3 compared with other analytes diluted to 1% of saturated vapor concentrations.

Selectivity plot of the assembled Py-rGO sensing device. Selectivity plot of the assembled Py-rGO sensing device exposed to 100 ppm NH3 compared with other analytes diluted to 1% of saturated vapor concentrations.