Figure 6.

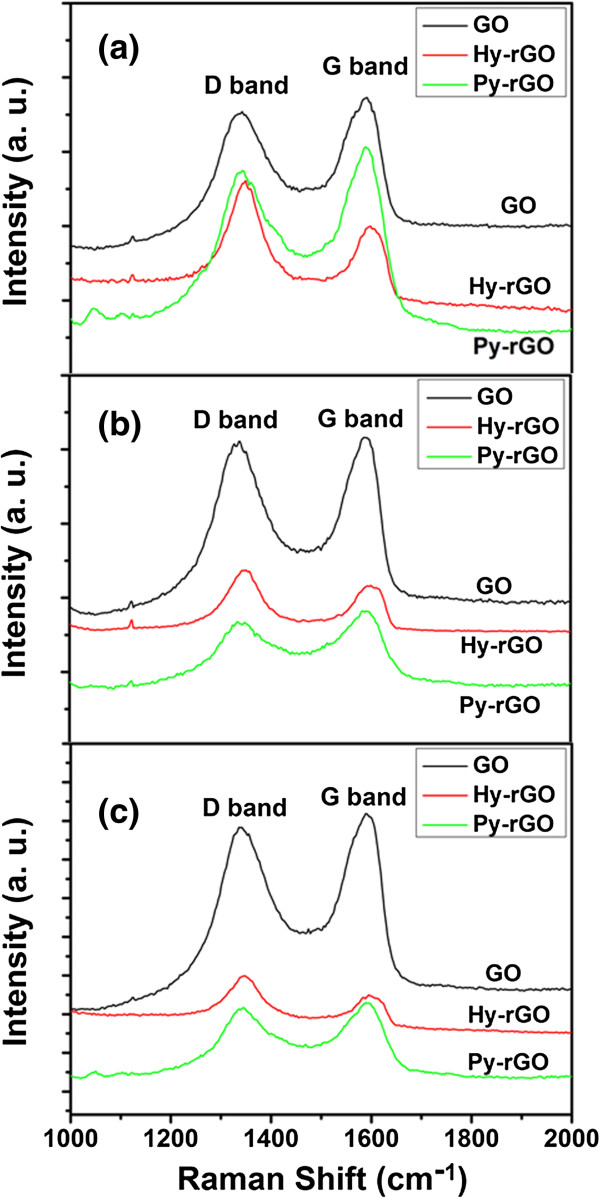
Raman spectra of GO, Hy-rGO, and Py-rGO after assembly of the electrodes with GO concentrations. (a) 1 mg/mL, (b) 0.5 mg/mL, and (c) 0.25 mg/mL with the excitation wavelength at 514 nm.

Raman spectra of GO, Hy-rGO, and Py-rGO after assembly of the electrodes with GO concentrations. (a) 1 mg/mL, (b) 0.5 mg/mL, and (c) 0.25 mg/mL with the excitation wavelength at 514 nm.