Figure 7.

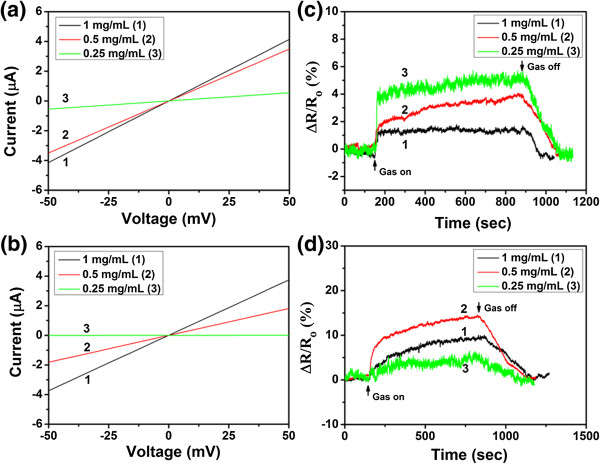
The comparison of sensing properties of devices based on assembled rGO sheets.I-V curves of sensing devices based on Hy-rGO (a) and Py-rGO (b) fabricated with GO assembly concentration at 1, 0.5, and 0.25 mg/mL. Plot of normalized resistance change versus time for the sensing devices based on Hy-rGO (c) and Py-rGO (d) fabricated with GO assembly concentration at 1, 0.5, and 0.25 mg/mL (the concentration of NH3 gas is 50 ppm).
