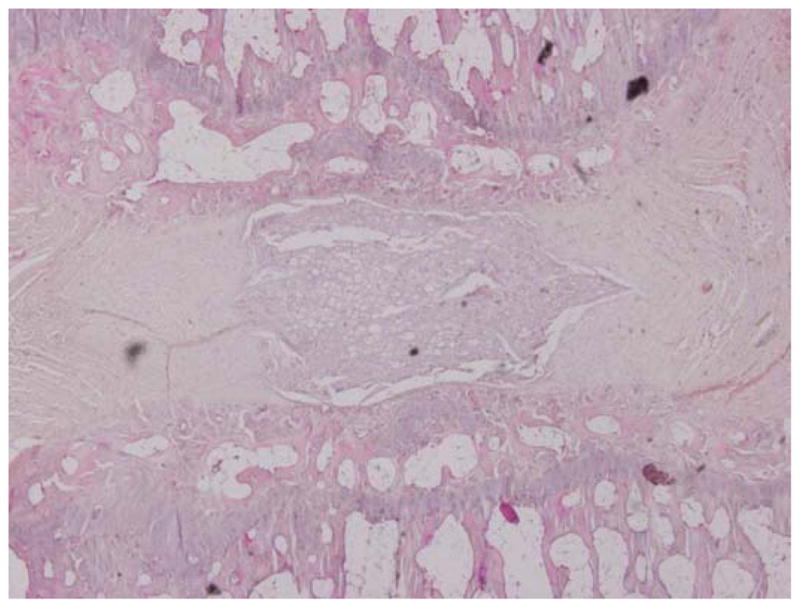
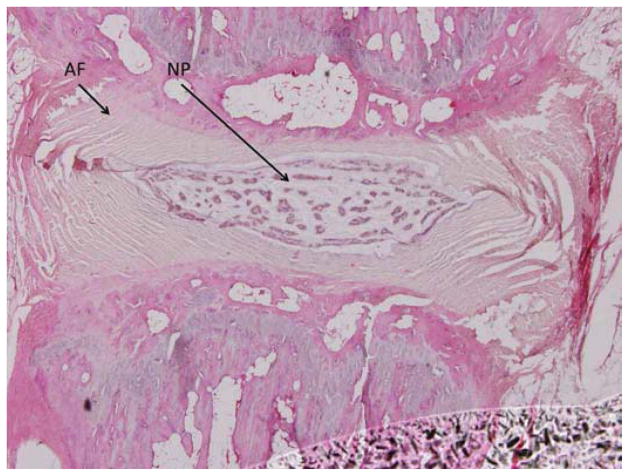
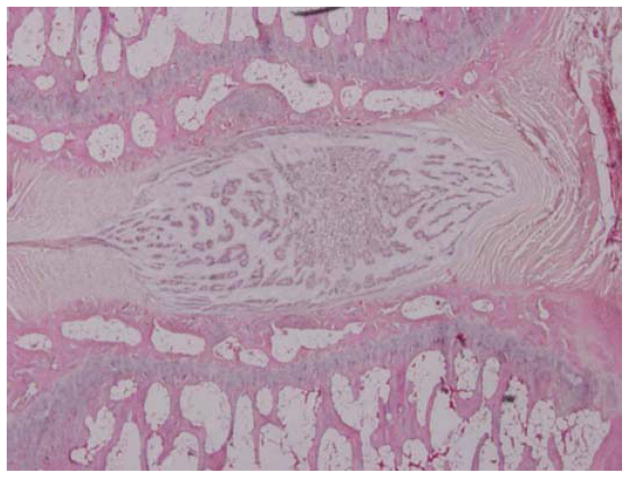
Figure 5.

Representative histological specimens of rats sacrificed at 24 weeks. A) Normal control. B) Disc treated with 5 mg/mL simvastatin. C) Disc treated with 15 mg/mL simvastatin. Note in A and B the regular appearance of the AF, the intact border of the AF and NP, and the increased cellularity compared to C. (Images at 4x microscopic power.)


