
Figure 1.
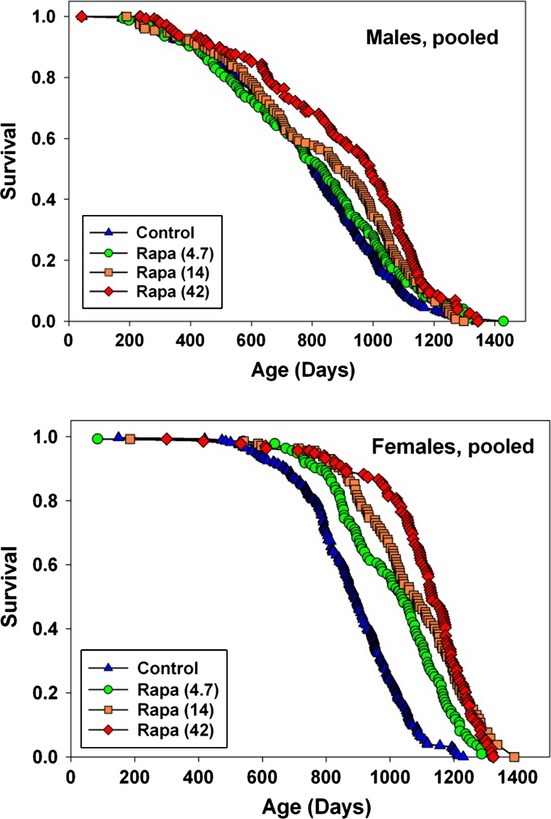
Survival curves at varying doses of rapamycin. Survival curves for male (top) and female (bottom) mice exposed to varying doses of rapamycin from 9 months of age. Data are pooled across the three test sites. At the time of analysis, fewer than 1% of the mice were still alive. Significance tests, median age, age of 90% mortality, and numbers of mice are shown in Table 1.