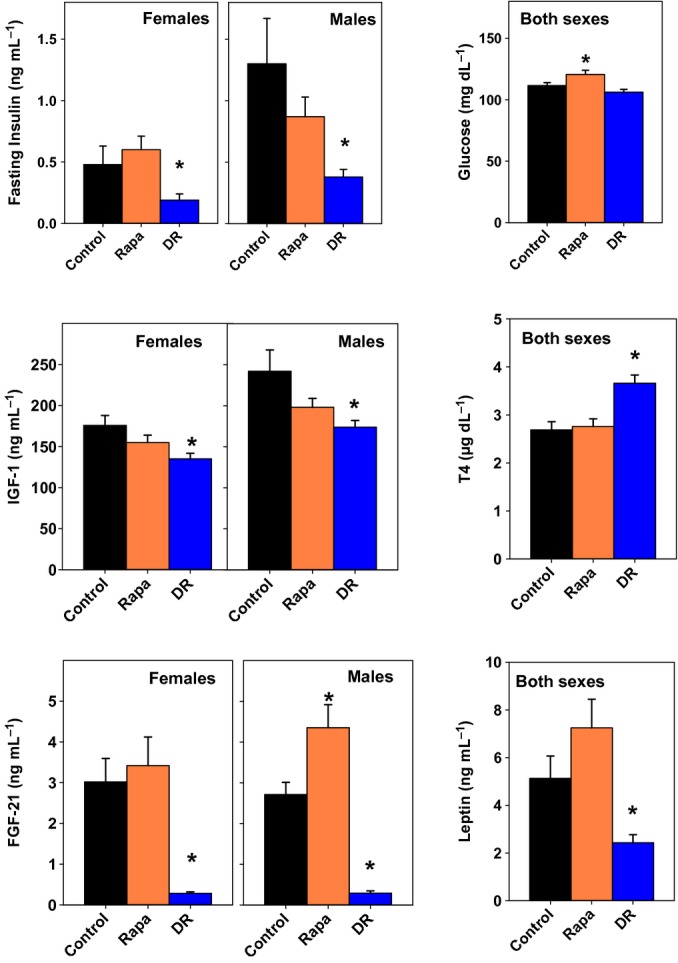
Figure 3.

Metabolic status of dietary restriction (DR) and rapamycin-treated mice. Endocrine and metabolic endpoints in control, rapamycin-treated (at 14 ppm), and DR mice evaluated in plasma at 9 months of age after an overnight fast. DR and rapamycin exposure were begun at 4 months of age. Each bar shows mean and standard error of the mean for 8–10 animals of each sex. For insulin, IGF-1 and FGF-21, anova indicated a significant difference between males and females, and thus, each sex was analyzed separately. Sexes are pooled for the analyses of glucose, T4, and leptin. An asterisk indicates significant difference from control mice at P < 0.05. DR and Rapa mice differed at P < 0.006 for each endpoint, except IGF-1, for which there was no significant difference.
