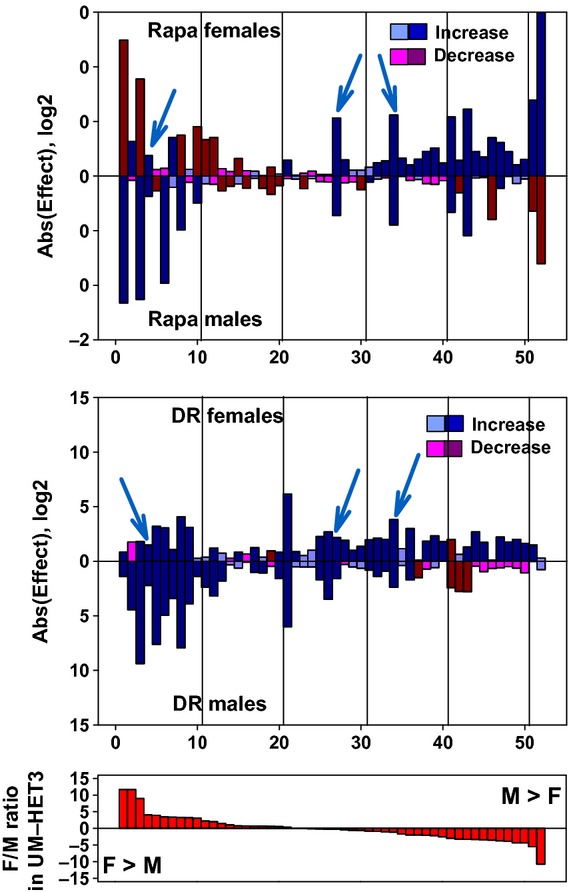
Figure 5.

Expression of mRNA for liver genes involved in xenobiotic metabolism. Effects of rapamycin (top panel) and DR diet (middle panel) on hepatic mRNA levels for 52 genes related to xenobiotic metabolism. Top and middle panels: mice were placed on rapamycin (14 ppm) or DR diet at 4 months of age and euthanized at 12 months of age. There were six males and six females in the control group and in each of the two treatment groups. All mice were housed at UM. Data from treated female mice are shown in the top of each panel, bars pointing upwards, and data from treated male mice are shown in the bottom half, with bars pointing downwards. The length of each bar is shown on a log2 scale, as the ratio of treated mice divided by control mice. Bars shown in blue are increases compared with control, and bars shown in red are decreases compared with control mice. Thus, a blue bar with a value of eight represents an increase of 28=256-fold above control levels, and a red bar with a value of eight represents a decline of 256-fold below control levels. Dark blue and dark red bars show genes for which the nominal (unadjusted) P-value is P < 0.05. Lighter blue and red bars shown genes that do not reach this arbitrary significance threshold. The first gene, for example, Sult2a2 (see Table S3), is increased by DR, slightly but significantly, in both males and females, is dramatically increased (by 211.6 = 3100-fold) by rapamycin in males, but shows a large (212.4 = 5400-fold), significant decline in rapamycin-treated females. The cyan arrowheads point out the three mRNA that are elevated by both DR and rapamycin in both sexes.The bottom panel shows female/male ratios, for untreated UM-HET3 controls; genes at the left are expressed at levels approximately 212-fold higher in female controls, and genes at the right are expressed roughly 211-fold higher in male controls.
