Figure.
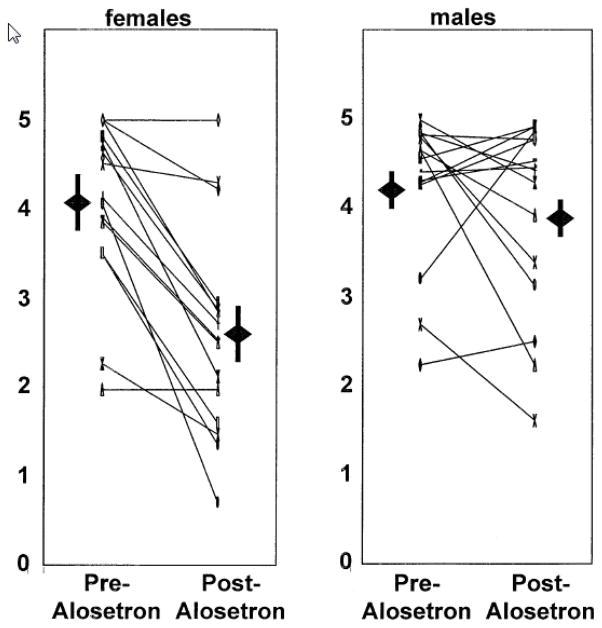
Scatter plot of geometric centers of colonic transit at 24h pre- and post-alosetron in females and males with diarrhea-predominant irritable bowel syndrome. The range of geometric center is 0 for location of isotope at the ileocecal valve, and 5 for all isotope located in stool. Also shown are the mean + SEM for each data set.

