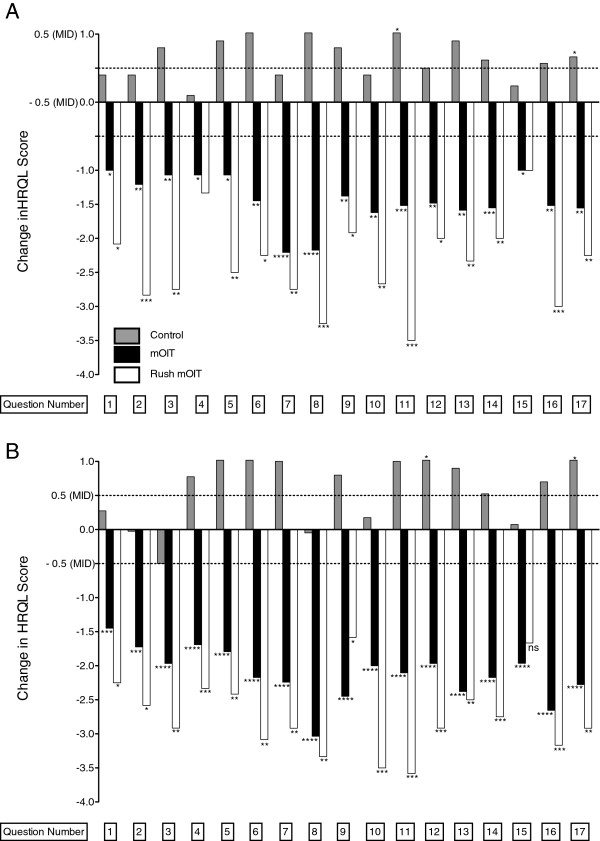
Figure 3.

Changes in individual FAQL-PB question scores. Changes in individual FAQL-PB question scores are shown between and (A) 6-month follow-up and (B) 18-month follow-up. * p < 0.05, ** p < 0.01, *** p < 0.001, **** p < 0.0001. Bars without asterisks represent non-significant changes.
