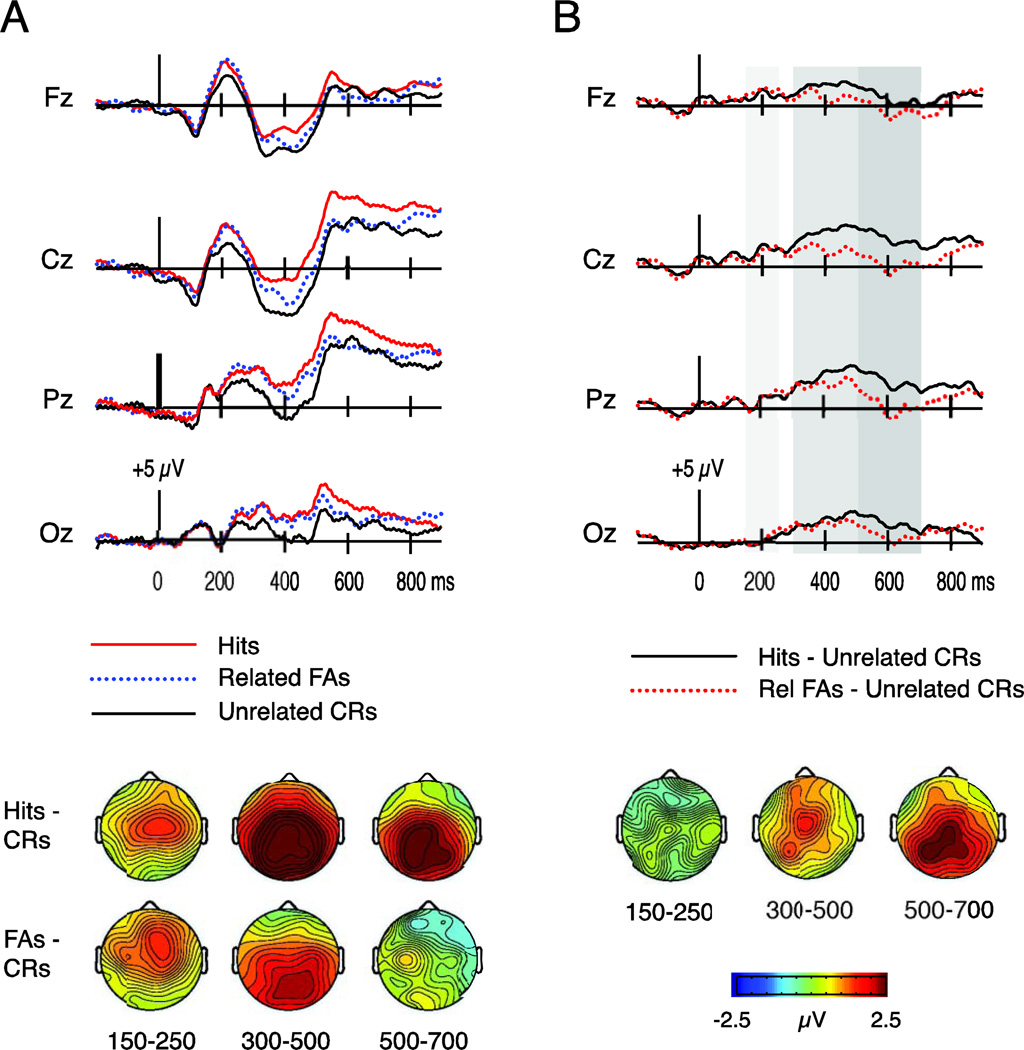
Figure 3.
ERPs to hits, related false alarms (FAs), and unrelated correct rejections (CRs) in Experiment 2. A) Waveforms at four midline electrodes (Fz, Cz, Pz, Oz) and topography of differences among conditions at 150–250 ms, 300–500 ms, and 500–700 ms. B) Waveforms depicting the subtraction between hits and unrelated CRs along with the subtraction between related FAs and unrelated CRs. Waveforms are shown for four midline electrodes (Fz, Cz, Pz, Oz). Topographic maps depict the hit/unrelated CR effect minus the related FA/unrelated CR effect over each time interval. Gray shading on the waveforms indicates the time intervals of interest (150–250 ms, 300–500 ms, 500–700 ms).

