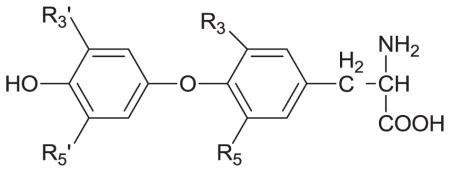
Table 1.
Site-specific association equilibrium constants (Ka) for thyroxine and related compounds with HSA at 37°Ca

| |||||||
|---|---|---|---|---|---|---|---|
| Compound | R3 | R5 | R3′ | R5′ | Chiral form | Ka(M−1 × 10⁵)a | |
| Sudlow site I | Sudlow site II | ||||||
| Thyroxine (T4) | I | I | I | I | L-T4b D-T4 |
1.4 (± 0.1) 5.5 (± 0.9) |
5.7 (± 0.8) 29 (± 2) |
| Triidothyronine (T3) | I | I | I | H | L-T3 D-T3 |
0.170 (± 0.001) 1.45 (± 0.06) |
0.25 (± 0.02) 1.2 (± 0.2) |
| Reverse Triiodothyronine (rT3) | I | H | I | I | L-rT3 | 1.99 (± 0.07) | 3.3 (± 0.6) |
| Diiodothyronine (T2) | I | I | H | H | L-T2 | 0.63 (± 0.03) | 1.16 (± 0.06) |
| Thyronine (T0) | H | H | H | H | L-T0 | 0.18 (± 0.02) | ------- |
