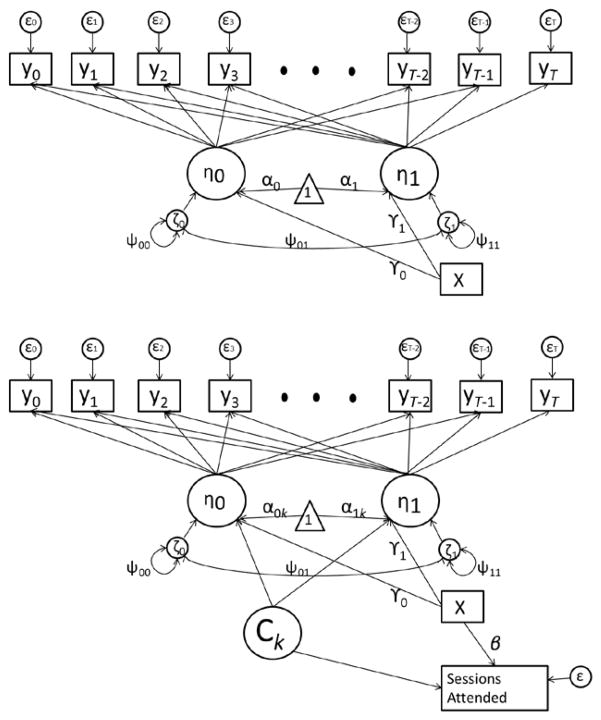
Figure 1.
Contrasting path diagrams of a LCM (top) and a SPMM (bottom). McArdle and Epstein’s (1987) RAM notation is used. Circles represent unobserved/latent variables (i.e., growth factors η, latent classes Ck, disturbances ζ, and error terms ε); rectangles represent measured variables; the triangle represents the mean structure (i.e., intercepts α) for the growth factors. The SPMM semi-parametrically incorporates information about the dependence between missing data (operationalized as the number of sessions attended) and the trajectory of psychological functioning (yt). This is done by allowing the growth factor means α0 and α1, as well as the mean number of sessions attended, to vary across K latent classes.

