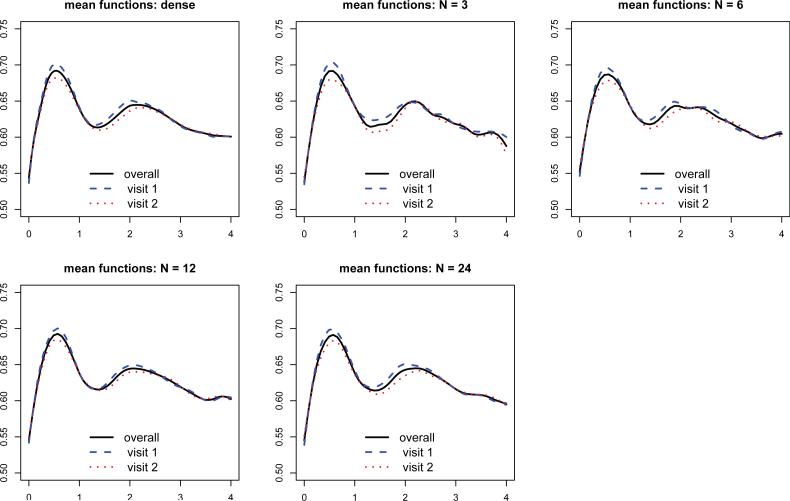
Figure 2.
Estimated mean functions from MFPCA for the SHHS data: dense and sparse cases. The upper left panel shows estimated mean functions from the full analysis using dense data. The four remaining panels correspond to results from sparse cases, with the number of grid points per curve N = 3, 6,12, 24, respectively. In each subfigure, solid lines correspond to overall mean functions, , while dashed and dotted lines represent visit specific mean functions, , at visit 1 and 2, respectively.

