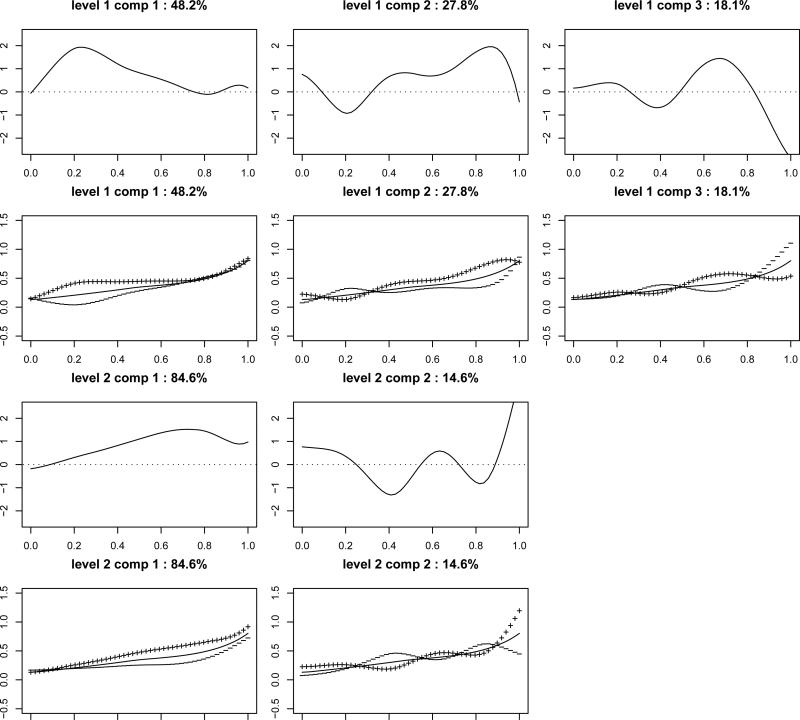
Figure 6.
Estimated eigenfunctions at level 1 (Rows 1-2) and level 2 (Rows 3-4). In Row 1 and 3, the solid lines represent estimated eigenfunctions. In Row 2 and 4, solid lines represent the overall mean function μ(t), and the lines indicated by “+” and “-” are mean function plus or minus a multiple of , respectively. Namely, “+” represents , and “-” represents for some constant c.

