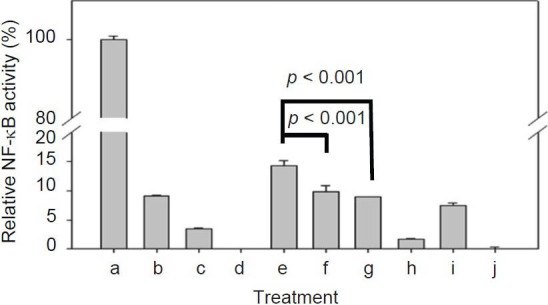
Figure 3.

Effect of inhibitors on LPS and DsCE-I induced NF-κB activation in B-16 cells. Data are represented as the mean ± SD. (a: 0.1 μg/ml LPS, b: 0.1 μg/ml LPS + 15 μM SB203580, c: 0.1 μg/ml LPS + 30 μM PDTC, d: 0.1 μg/ml LPS + 400 units polymyxin B, e: 100 μg/ml DsCE-I, f: 100 μg/ml DsCE-I + 15 μM SB203580, g: 100 μg/ml DsCE-I + 30 μM PDTC, h: 100 μg/ml DsCE-I + 15 μM SB203580 + 30 μM PDTC, i: 100 μg/ml DsCE-I + 400 units polymyxin B, j: control)
