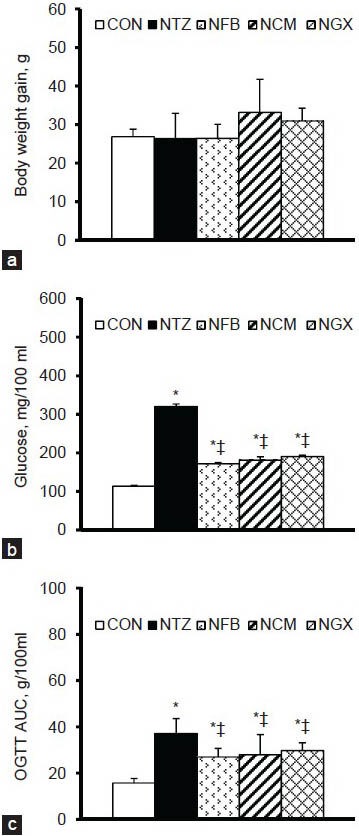
Figure 1.

(a) Body weight gain from day 0 to day 14, (b) blood glucose concentrations in the 2-h postprandial period, and (c) blood glucose response in OGTT shown as area under the curve (AUC) in normal and IGT rats. Values are expressed as the means ± SEM (n = 8-9 per group). Differences were assessed using one-way ANOVA, followed by post-hoc tests of least significant difference (LSD). *P< 0.05 vs. CON group; ‡P< 0.05 vs. NTZ group in IGT rats
