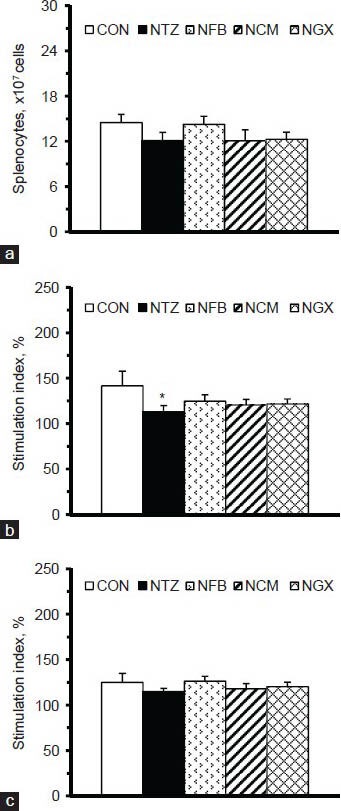
Figure 3.

(a) The numbers of splenocytes and stimulation indices of cell proliferation in splenocytes (5 × 10⁶ cells/ml) cultured with (b) Con A and (c) LPS. The stimulation index was calculated as the OD values (at 490 nm) of the splenocytes cultured with Con A or LPS divided by those cultured in medium alone, and multiplied by 100. Values are expressed as the means ± SEM (n = 8-9 per group). Differences were assessed using one-way ANOVA, followed by post-hoc tests of least significant difference (LSD). *P< 0.05 vs. CON group
