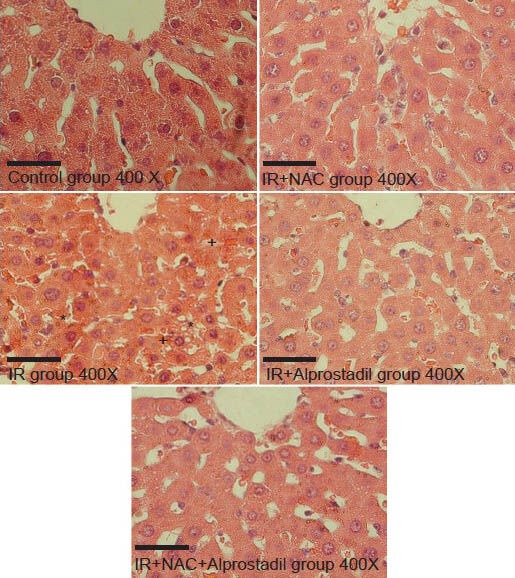
Figure 3.

Liver histological analysis. In the control group, normal liver parenchyma cells appear with hepatocytes and sinusoids around the central vein and show regular morphology. In the I/R group, hepatocytes are prominently swollen with marked vacuolization (*). Congestion (+) is noted in enlarged sinusoids. The liver parenchyma cells accompanied by hepatocytes and sinusoids around the central vein show irregular morphology. In the I/R + NAC group, the I/R + alprostadil group, and the I/R + NAC + alprostadil group, hepatocytes and sinusoids are present with normal morphology reflecting well-preserved liver parenchyma cells. The scale bars represent 50 μm. (H and E, ×400)
