
Figure 6.
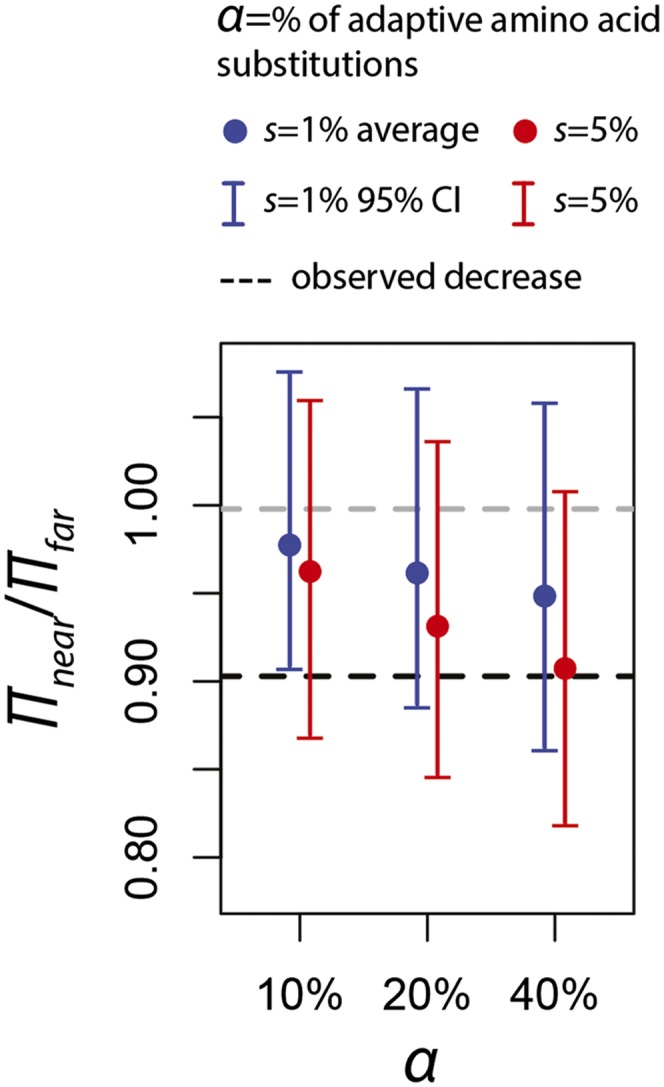
Simulated decreases of diversity for different rates and strengths of positive selection. We ran 100 forward simulations (Methods) to estimate the average and 95% confidence intervals (CI) for the decrease of diversity near amino acid changes under different rates and strengths of positive selection. To be conservative, we extended the confidence intervals from simulations by 35% given that neutral simulations underestimate the variance by ∼35% in the simulated regions, as shown in Figure 1.