
Figure 3.
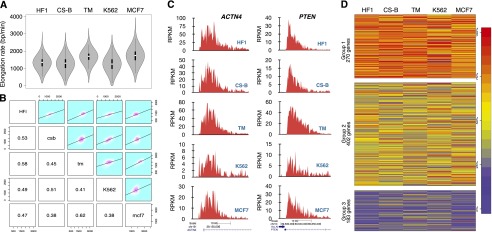
Comparisons of transcription elongation rates among five cell lines. (A) Cells were treated with DRB for 60 min followed by drug reversal and immediate incubation with 2 mM Bru for 10 min. BruDRB-seq was then performed and violin plots illustrating the distribution of elongation rates in the indicated cell lines are shown (the interquartile ranges are represented by thick vertical bars and white dots indicate the median values). Sample sizes: (HF1) 2702; (CS-B) 1932; (TM) 2469; (K562) 2270; (MCF-7) 2399. (B) Grid of pairwise comparisons of elongation rates between each of five cell lines. Each individual comparison includes those genes with measurable elongation rates that are expressed in both cell lines. Frequencies and linear regression models are plotted in the upper right panels and respective Pearson’s correlation coefficients in the lower left. (C) Examples of two individual genes showing similar elongation rates in the five cell lines. (D) Genes expressed in all five cell lines (855 genes) were clustered by normalized elongation rate into three groups using the k-medoids method. Genes in Group 1 tend to be faster-elongating in multiple cell lines, and genes in Group 3 tend to be slower in multiple cells. Genes belonging to Group 2 (47% of total genes) consist of genes with intermediate or variable elongation rates across cell lines. Genes are colored by percentile ranking within each cell line (100% is highest elongation rate [red]). (HF1) Human foreskin fibroblasts; (CS-B) Cockayne syndrome fibroblasts B; (TM) human skin fibroblasts; (K562) myelogenous leukemia; (MCF-7) breast cancer.