Figure 5.
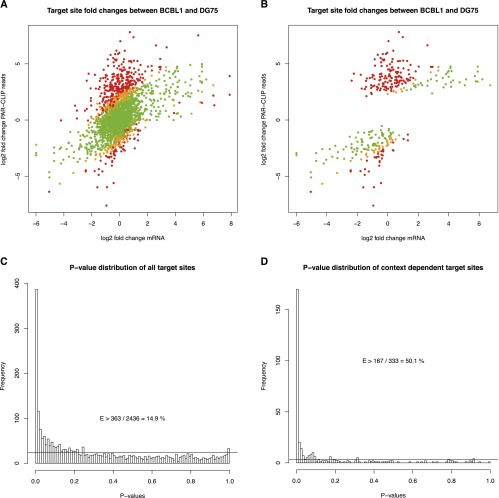
Comparison of mRNA fold changes to PAR-CLIP read count fold changes. (A) Scatterplot comparing mRNA fold changes to PAR-CLIP read count fold changes of all target sites of the cellular microRNAs analyzed. For the PAR-CLIP data, a pseudocount of 1 was used. Green dots represent target sites that can be explained by the mRNA fold change while respecting sampling noise of the read counts, whereas orange and red dots correspond to significant outliers (P < 0.05 and P < 0.01, respectively). The P-value distribution in C of all these target sites suggests that at least 14.9% (363 instances with P < 0.01 of overall 2436 target sites after subtraction of baseline indicated by the horizontal line) of all differential target site activities cannot be explained by the mRNA fold change and sampling noise. B and D illustrate this for the context-dependent microRNA/target interactions only. Here, >50% of all sites cannot be explained by mRNA levels (see also Supplemental Fig. S5).

