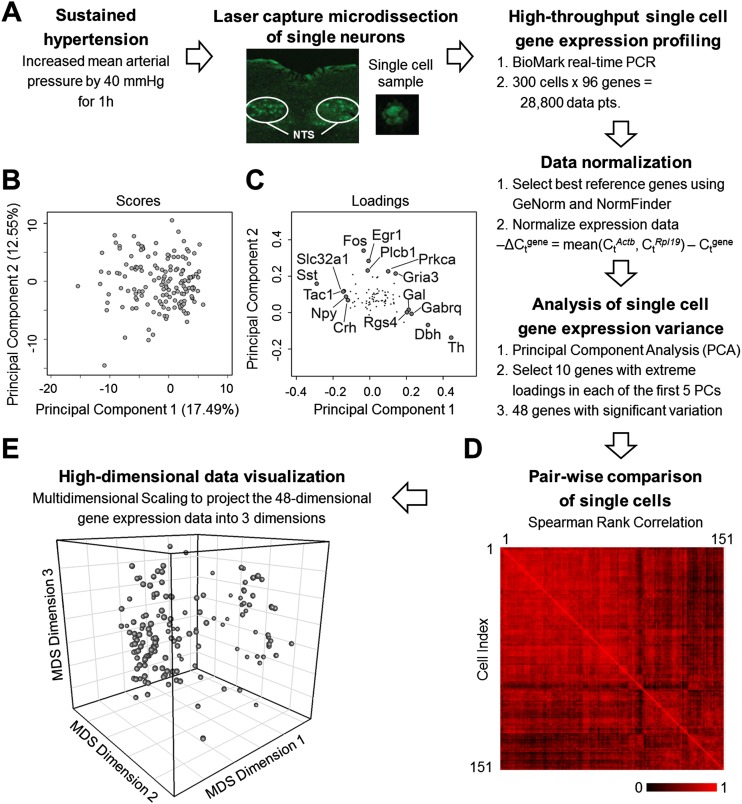
Figure 1.
Single neuron gene expression analysis. (A) Workflow summary of our experimental approach to obtain single cell samples and measure gene expression. (B) PCA of the gene expression data of single cells from hypertensive rats was performed to analyze variation within gene expression data. Projection of single cells (scores) along the first two principal components (PCs) is shown. Additional components were explored (Supplemental Information). (C) Loading values of the genes along the first two PCs. Genes with the five highest and lowest loading values along PC 1 and genes with the five highest loading values along PC 2 are labeled. The highest and lowest genes along the multiple PCs explored provided the basis for the selection of a subset of 48 genes with significant contributions to variability observed in the data. (D) Pairwise comparison of single cells based on Spearman rank correlation coefficients. Single cells are compared based on their respective 48-gene rank order. Red indicates a high correlation between cells; black represents no correlation between a pair of single cells. (E) The Spearman rank correlation coefficients are used to determine the similarity distance between each cell. The high-dimensional set of similarity values between all possible single cell pairs are then projected into three dimensions using MDS. Thus each sphere in this three-dimensional space represents a single neuron. The relative distance between two spheres in this 3D space corresponds to the relative similarity (or dissimilarity) between two cells.

