Figure 2.
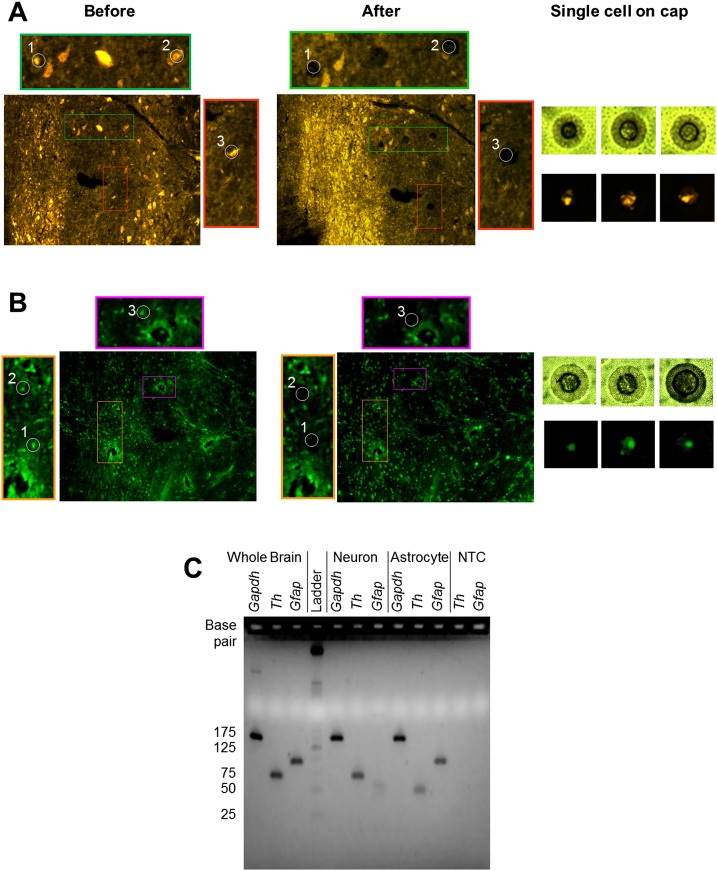
Single neuron and astrocyte LCM. (A) Tyrosine hydroxylase (TH) immunohistochemical staining and collection of TH+ single cells from a coronal section of a normotensive rat brainstem. Colored outline images represent magnified tissue sections from which TH+ single cells were captured. (B) Glial fibrillary acidic protein (GFAP) immunohistochemical staining and collection of GFAP+ single cells from an adjacent coronal section of a normotensive rat brainstem. Colored outline images represent magnified tissue sections from which GFAP+ single cells were captured. (C) Gel electrophoresis image of reverse-transcribed cDNA from whole-brain tissue (positive control) (lanes 1–3), a representative single neuron sample (lanes 5–7), a representative astrocyte sample (lanes 8–10), and a no-template control (NTC) (negative control) (lanes 11,12). All samples underwent 22 pre-amplification cycles prior to undergoing a 40-cycle PCR. Products from the 40-cycle PCR were placed on an E-Gel EX Agarose Gel 4% (Invitrogen). The rat whole brain positive control shows product bands for Gapdh (148bp), Th (68bp), and Gfap (93bp). Both single neuron and astrocyte samples show formation of Gapdh. However, the neuron sample does not show any Gfap product at the expected 93-bp size. A light band in lane 7 at <50 bp suggests a nonspecific product. Similar behavior is observed in lane 9, where the astrocyte sample shows no Th product at the expected 68-bp size. Only a light product band at <50 bp is present, suggesting a nonspecific product. The results indicate minimal to no crossover contamination occurring between astrocytes and neurons.

