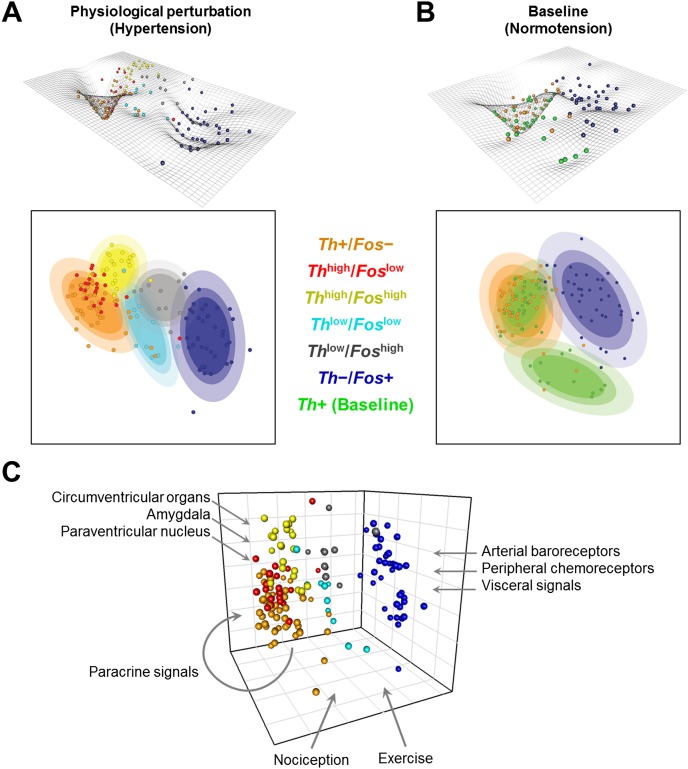
Figure 7.
Reversible cell states within the phenotype landscape shaping the variability and organization of single cell states. Contour plots are used to illustrate the concepts of distinct cell states and the influence that inputs have in determining these states. The contour plots are a projection of the single cells in the 3D MDS space onto a 2D plane. The landscape topography is based on an inversion of the probability densities of single cells. Cell states are represented by wells in the landscape and ellipsoid regions in the 2D contour plot. The colored ellipsoids capture these states and symbolically represent potential “attractor”-like states within this landscape. These contour and landscape topographies were created for single cells collected from rats undergoing an acute hypertension challenge (A) and from baseline normotensive rats (B). Comparing these two landscapes (A and B) shows that the well in which catecholaminergic cells (orange spheres in A and B) lie is much more constrained and local under the hypertensive challenge than in the baseline state. The changing landscape between the two physiological states suggests that physiological perturbation (e.g., hypertension) influences not only the state of the single cells, but the very nature of the landscape in which they exist. Thus inputs have a significant impact on transcriptional behavior and ultimately the phenotypic state of a cell. (C) Input-based gene expression phenotypes in NTS. Schematic of the influence of various inputs into the NTS shaping the cellular state and organization within a “homogeneous” single cell phenotype. Integrative inputs place demands on homeostasis such as those conveying visceral states, pain, posture, exercise, temperature, circadian time, mood etc. NTS neurons must integrate distinct combinatorial input sets. Our data revealed that gene expression variability across single neurons reflects their combinatorial inputs.

