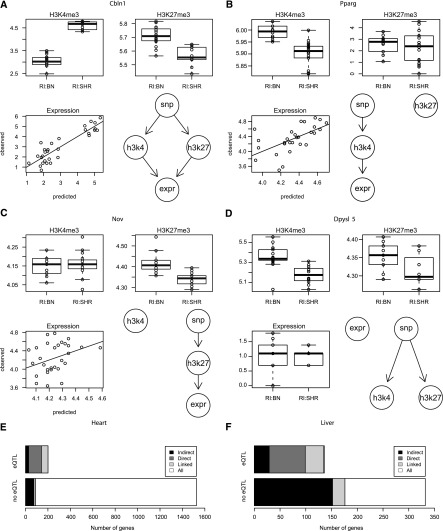
Figure 4.
Integrated analysis of histone modifications and gene expression. We determined the most likely model of how genetic variants influence histone modification levels and gene expression using a likelihood-based model selection procedure. The competing models are shown in the bottom right panel of each subfigure. (A full list can be found in Supplemental Fig. 8.) The boxplots in the top row show that levels of both histone marks of Cbln1 (A) are genotype dependent in opposite directions and predict gene expression levels with high correlation (bottom left). Histone modification levels of only one lysine residue, either H3K4me3 or H3K27me3, are genotype dependent for Pparg (B) and Nov (C). We also observe instances such as Dpysl5 (D) where modification levels of both histone marks are genotype dependent but in the same direction, which leads to a buffering and no effect of the genotype on gene expression. A summary of the integrated analysis for heart (E) and liver (F) shows how many genes were analyzed and how often we were able to link gene expression and genetic variation either directly or indirectly via an intermediate histone mark. In some cases we are not able to distinguish direct and indirect models, but nevertheless the set of models that contained a path from the genetic variant to gene expression was selected against all other competing models (bootstrap P > 0.95). The total number of genes linked by the integrated analysis is substantially larger than the number of genome-wide significant eQTLs.

