Figure 1.
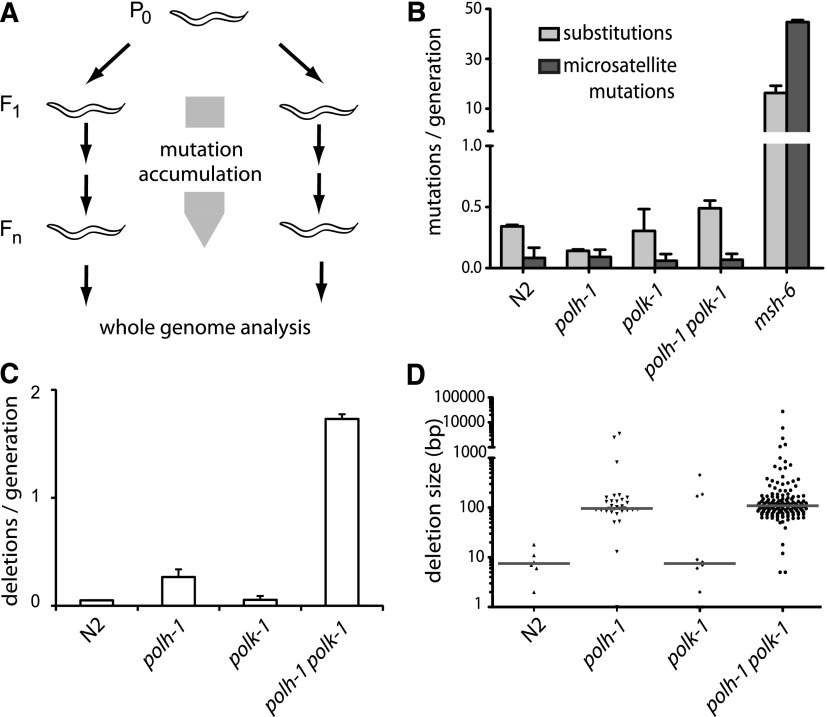
Spontaneous mutagenesis in TLS-deficient strains. (A) Generation of mutation accumulation (MA) lines. For each genotype, multiple populations were started by cloning out single worms from a single hermaphrodite P0. Cultures were propagated by transferring animals to new plates each generation. At generation Fn, a single animal was grown to a full population, from which genomic DNA was isolated and subjected to whole-genome sequencing on an Illumina HiSeq. (B) Substitution and microsatellite mutation rates for the indicated genotypes. Mutation rates are expressed as the number of mutations per generation divided by the fraction of the genome covered >3 times in all samples. (C) Rates of structural variations for the indicated genotypes. (D) Size distribution of deletions in the different mutant backgrounds. The median sizes are indicated by the gray horizontal lines.

