
Figure 2.
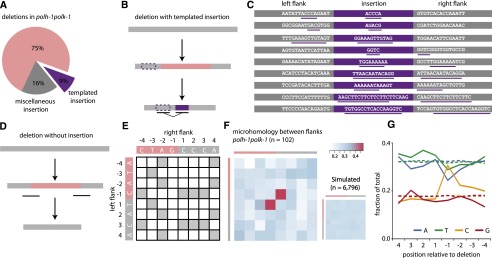
Deletion footprints in TLS mutants indicate a priming-based end joining mechanism. (A) Distribution of deletion footprints in polh-1polk-1 mutants. (B) Schematic illustration of a deletion associated with a templated insertion. Deleted sequence in pink; newly inserted sequence in purple and its template boxed; nonaltered DNA in gray. (C) Sequence context of deletions with templated insertions derived from polh-1polk-1 animals. Matching sequences are underlined. (D) Schematic illustration of a deletion not accompanied by insertions. Deleted sequence in pink; nonaltered DNA in gray. The eight-nucleotide window, capturing neighboring flanking and deleted sequences and used for the generation of the heat maps, is underlined. (E) The strategy to score junction homology: For each simple deletion, matching bases between the 5′ and 3′ junction were scored 1, nonmatching bases were scored 0, thus creating one map per deletion. (F) A heat map representing the sum of all individual deletion maps derived from polh-1polk-1 animals (n = 102). A heat map for a simulated set of deletions (n = 6796) with random distribution is displayed on the right. (G) Base composition at the 5′ and 3′ junctions. The flanking sequences have positive numbers, the deleted sequences have negative; −1 being the first nucleotide within the deletion. Dotted lines indicate the relative abundance of a particular base for a simulated set of deletions (n = 6796).