
Figure 4.
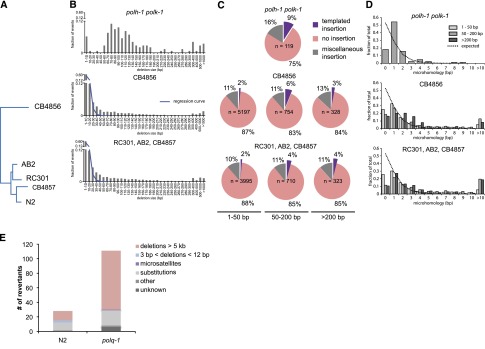
Signature of pol theta-mediated end joining in natural isolates of C. elegans. (A) Phylogenetic tree diagram of the different isolates of C. elegans used in this study. (B) Size distribution of deletions of evolutionary distinct C. elegans species compared to size distribution of polh-1polk-1-derived deletions. An exponential regression curve describes the size distribution of deletions in both natural isolates up to 20 bp; deletions up to 200 bp are overrepresented. (C) Deletions in natural isolates, especially in size class 50–200 bp, show templated insertions analogously to deletion footprints in polh-1polk-1 animals. (D) Microhomology for deletions in natural isolates as compared to deletions in polh-1polk-1 animals. (E) unc-93 mutagenesis in polq-1 worms and wild-type controls.