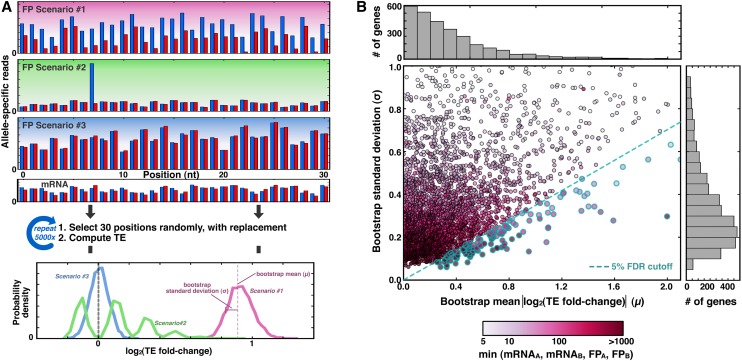
Figure 2.
A total of 4.2% of genes show translational allelic bias. (A) Schematic of the bootstrapping procedure. (Top) For a mock gene containing a single SNP, ∼30 consecutive positions contain allele-specific information, and three scenarios for read distributions are shown: (#1) shows reproducible bias toward allele A in blue; (#2) shows how a single position could suggest a bias that is not supported by other positions, and (#3) shows a consistently reported lack of bias. (Middle) For each of 5000 iterations, 30 positions are selected randomly and with replacement, and a TE value is calculated from the mRNA and FP reads from those positions. (Bottom) The results are tabulated into a histogram, where the mean and standard deviation of the bootstrap distribution reflect the magnitude and confidence, respectively, of allele-specific bias in TE. (B) Scatterplot and accompanying histograms (top and right) showing the bootstrap means and standard deviations for the 3285 genes with at least five reads for mRNAA, mRNAB, FPA, and FPB (shading indicates the metric with the fewest read counts, as shown in the legend at bottom). Blue-rimmed circles indicate genes that pass the 5% FDR threshold.

